Skip to content
bristol bridge

Published May 22, 2026

Rentaroof Bristol Rental Market Report – Q1 2026

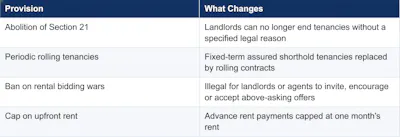
This market report presents an overview of the Bristol rental market in Q1 2026, based on data from rentaroof.co.uk. Using 7,557 rented properties, the report examines developments in rental prices, supply levels, and property turnover across the city. The analysis provides insight into how market conditions evolved during Q1 2026 and highlights key patterns within Bristol's rental sector. Q1 2026 coincides with the enactment of the Renters' Rights Act, effective 1 May 2026, the most significant legislative reform of England's private rented sector in a generation. Key provisions include the abolition of Section 21 'no-fault' evictions, the transition to periodic rolling tenancies, a ban on rental bidding wars, and a cap on upfront rent at one month. A dedicated section later in this report examines how these changes interact with the market indicators recorded in Bristol this quarter.

Key Takeaways

  • The average monthly rent in the city stood at £1,464 in Q1 2026, representing a 3.8% year-on-year decrease compared to £1,522 in Q1 2025.
  • Rental supply reached 7,557 listings in Q1 2026, based on archived Rentaroof.co.uk data.
  • Houses and rooms were the only property segments to record rental price growth year-on-year, both increasing by 0.6%.
  • The average time a rental property remained on the market increased to 31 days in Q1 2026, up from 25 days a year earlier. This 24% increase points toward a slower-moving rental market compared to Q1 2025.
  • Student-friendly rental supply accounted for 2,764 listings, representing 36.6% of the city’s total rental supply in Q1 2026. This highlights the continued importance of the student market within the city’s overall rental sector.

Rental Prices in Bristol Q1 2026

The average monthly rent in Bristol reached £1,464 in Q1 2026, a year-on-year decrease of 3.8% from £1,522 in Q1 2025. The decline is broad-based: all five districts in the dataset recorded price reductions. The correction is driven primarily by the flat segment, the largest by volume, which fell 3.6%. Rooms and houses recorded marginal increases of 0.6% each.

Rental Prices by Property Type in Bristol

Rooms anchor the affordable segment of the market, serving primarily student and lower-budget tenants, with the minimal price movement indicating stable demand relative to supply. Flats, as the dominant property type by volume, exert the greatest influence on the overall average: the £57 monthly decline in flat rents accounts for the majority of the city-wide reduction. Houses, which serve family and larger household demand, held their value with marginal growth, remaining the highest-priced segment at £2,009 per month. The £1,352 spread between houses and rooms illustrates the breadth of Bristol's rental market.

Rental Prices by District in Bristol

The steepest decline occurred in City Centre (-10.9%), reflecting a high concentration of flat-type supply in an area where the flat segment has experienced the most pronounced price correction. Despite the adjustment, City Centre retains the second-highest average rent, reflecting the continued premium attached to the central location. Horfield, the highest-priced district at £1,802, recorded the most modest decline at 1.6%, suggesting demand has remained robust at the premium end. At the lower end, Bedminster (-8.5%) and Easton (-5.2%) remain the most affordable districts, with Easton's £1,103 average positioned £699 below Horfield. The consistency of downward movement across all five districts indicates a market-wide adjustment rather than a localised trend.

Supply Overview Bristol Q1 2026

Total rental supply in Bristol comprised 7,557 rented properties in Q1 2026. This figure represents the volume of properties let and recorded across the city during the quarter, based on Rentaroof data

The three highest-supply districts, Horfield, Redcliffe and City Centre are concentrated in Bristol's northern and central areas and together account for 15.1% of total Q1 2026 supply. All three are priced above the city-wide average of £1,464. Horfield dominates both by rental property count and rent level. Redcliffe, despite being second in volume, stands out for its absorption rate: properties there let in an average of 18 days, the fastest in the city. Tenants seeking greater affordability will find lower competition in districts such as Bedminster and Easton, where pricing is below the city average.

Student-Friendly Supply in Bristol

Student-friendly rental properties account for 37% of total Bristol supply in Q1 2026, above the UK average of 31%, reflecting the city's substantial higher education population and the prevalence of HMO (House in Multiple Occupation) and room-type accommodation. Horfield leads with 250 student-friendly rental properties, consistent with its position as the district with the largest overall supply volume. City Centre and Northville follow with 214 and 184 rental properties respectively, demonstrating that student rental demand is distributed across multiple districts rather than concentrated in a single area. Together, these three districts account for 648 of the 2,764 total student-friendly rental properties, or 23% of student-friendly supply. The scale of student accommodation in the market structurally suppresses the city-wide average rent, as this segment predominantly comprises lower-cost room and shared-property stock.

Rental Property Turnover in Bristol

The average time on market in Bristol increased from 25 days in Q1 2025 to 31 days in Q1 2026, a rise of 6 days or 24% year-on-year. This extension, combined with the 3.8% decline in average rent, indicates that demand absorption has slowed relative to the prior year and that pricing has adjusted accordingly.

Redcliffe and Montpelier are the fastest-moving areas in Bristol, with properties letting in 18 and 19 days respectively. Both are well-located, professionally oriented districts where demand remains concentrated despite the broader market slowdown. Southville, at 23 days, also outpaces the city average. At the other end, City Centre records the slowest absorption at 43 days, consistent with its 11% rent decline and a housing stock that skews heavily towards flats. Northville's elevated time on market (41 days) is partly attributable to the seasonal nature of student demand, which is cyclically concentrated rather than evenly distributed across a quarter. All districts, including the slowest-moving, absorb properties within approximately six weeks, indicating a functioning market throughout.

The Renters' Rights Act: Market Implications for Bristol

The Renters' Rights Act took effect on 1 May 2026, introducing the most significant structural reform of England’s private rental sector in a generation. Its key provisions will reshape how Bristol's rental market operates. This section examines the expected impact on three core indicators: rental prices, time on market and supply.

table about the key provisions of The Renters' Rights Act for Bristol

Impact on Rental Prices in Bristol with the Renters' Right Act

The ban on bidding wars removes a mechanism that has historically enabled landlords to encourage and accept higher offers above the advertised rent, especially in high-demand areas. In Bristol's fastest-moving districts, Redcliffe (18 days) and Montpelier (19 days), above-asking competition has been a structural feature of the market: tenants could secure a property by outbidding other applicants, compressing lettings times but pushing actual rents above the listed prices.


Under the new framework, the advertised rent becomes a ceiling rather than a starting point. In our opinion, this will result in two opposing effects. We expect the actual rental property prices to increase, since landlords won’t have the opportunity anymore to list below market value in order to generate competitive interest and a bidding war. Instead, as a likely unintended consequence of the Act, properties may be advertised at higher initial price levels to capture what was previously achieved through bidding. Scotland provides a direct precedent: following the introduction of its 2022 rent cap, advertised rents rose at the fastest rate of any UK nation, the opposite of the intended effect (ONS, April 2024). On the other hand, with no mechanism to exceed the advertised rent, tenants’ actual cost of renting will stabilise or even decrease.

Concluding: we expect the advertised rents to increase (especially in competitive areas), while effective rents paid by tenants may remain flat or decline further

Impact on Days on Market in Bristol with the Renters' Right Act

With bidding wars removed, tenant competition shifts from financial offers to speed and quality of application. The impact on letting times however will not be uniform across Bristol.

In premium, fast-moving districts such as Redcliffe and Montpelier, demand is structurally strong. Properties there let within less than 20 days under the current framework, and this pace is unlikely to slow down: tenants in these areas are motivated and tend to be well-prepared, and competition will simply express itself through faster applications rather than higher bids.

In the mid-market (particularly the flat segment and districts such as the City Centre and Kingsdown) letting times are more likely to extend. The National Residential Landlords Association (NRLA) already reported a significant increase in landlords with tighter tenant referencing criteria in advance of the Act. Without the shortcut of selecting the highest bidder, landlords are likely to take more time and apply stricter standards to tenant selection

Impact on Supply in Bristol with the Renters' Right Act

Of these three indicators, supply is where the evidence is strongest and most consistent: rental supply is expected to decline.

The pattern is well-documented internationally. In the Netherlands, the Dutch Affordable Rent Act, effective July 2024, led to a 20% decline in new rental properties within one quarter and a 70% increase in landlord property sales in Q1 2025 (Pararius, Q4 2025 Huurmonitor). In Scotland, landlord- driven property sales rose with nearly 60% as well following the 2022 rent cap.

In England, the trajectory points in the same direction. The English Private Landlord Survey, published by the Ministry of Housing in December 2025, shows that 31% of landlords are planning to reduce their portfolio (up from 22% four years ago), while 16% intend to sell all their properties within two years.

The abolition of Section 21 introduces a secondary supply effect. Tenants who can no longer be evicted without specified grounds are likely to remain in their properties for longer, reducing turnover and the frequency in which homes re-enter the market.

Bristol’s Q1 2026 supply of 7,557 rental properties provides the pre-reform baseline. Based on the weight of international evidence and stated landlord intentions, this figure may prove to be a high-water mark. Rentaroof will track supply, pricing and absorption quality on a quarterly basis to assess the Act’s measurable impact against this baseline.


Our founders view

Jasper de Groot, Founder of Pararius and Treehouse


“Britain is walking a path the Netherlands walked first, and Britain should pay attention to where it leads. Two Dutch laws together produced the damage we now measure every quarter: the abolition of fixed-term tenancies in July 2024 removed the landlord’s ability to plan around a contractual end date, and the Affordable Rent Act capped rents in the mid-market segment through a points system. The Renters’ Rights Act bundles the same two mechanisms into one statute. Open-ended periodic tenancies and the abolition of Section 21 mirror our fixed-term ban. A First-tier Tribunal that can only revise rents downward, never upward, is the structural twin of our points- based rent test: asymmetric, and therefore one-directional in its effect on supply. The Dutch result is on the record. More than 80,000 of the Netherlands’ 640,000 private rental homes, representing roughly 12.5% of the sector, have already been sold off and removed from the rental market. A net outflow from the private rental sector four times higher in Q1 2026 than a year earlier. Institutional investors now following private landlords out the door. Milton Friedman warned in 1946 that price ceilings produce ‘still worse evils’. Britain is about to find out what he meant.”

Methodology & About Rentaroof

Data & Methodology

This report is based on an analysis of advertised rental properties sourced from Rentaroof and collected over the Q1 2026 reporting period. The data covers a range of property types and locations within Bristol and focuses on key indicators: asking rents, rental property volumes, and time on market. Properties described as rented or let are identified based on rented properties, reflecting advertisements that moved off the market during the period analysed. Information relating to the Renters' Rights Act is drawn from publicly available UK Government publications. This report is intended for professional use by market participants, journalists, and housing sector professionals.

About Rentaroof

Rentaroof is an independent rental platform for the UK housing market. The platform gathers rental properties from reliable property websites across the country and presents them all in one place, providing one of the most complete and up-to-date overviews of available rental properties.

With smart search filters and instant alerts for new rental properties, Rentaroof helps users find suitable homes quickly and efficiently. Rentaroof is part of TreeHouse Netherlands, the company behind leading Dutch housing platforms Huurwoningen.nl and Pararius.nl.


Rentaroof Market Report by: Rohan Talwar, Market Researcher

The information and data presented in this report were accurate at the time of publication. No reliance should be placed on the contents of this report as a sole basis for decision-making. Rentaroof.co.uk and its associated parties make no representations or warranties regarding the completeness, accuracy, or suitability of the information provided, and accept no liability for any decisions made based on this content.